Unfortunately, due to the ongoing conflict in the Middle East, there may be some shipping delays. We’ll continue to keep customers updated and work hard to ensure our services run as smoothly as possible.


Moving overseas advice
Richest country in the world 2026
Key takeaways
- The richest country in the world in 2026 is Luxembourg, according to Visual Capitalist's latest Richest Countries in the World report.
- GDP (Gross Domestic Product) measures all goods and services produced within a country's borders, including foreign companies, while GNP (Gross National Product) includes all income earned by a country's residents and businesses, no matter where they are in the world, and then subtracts income earned by foreigners.
- The top 10 richest countries in the world are Luxembourg, Switzerland, Norway, Denmark, Australia, the US, Ireland, Singapore, the Netherlands, and Belgium.

What is the richest country in the world?
The richest country in the world is Luxembourg as of 2026, according to Visual Capitalist's recent Richest Countries in the World report. The global economic data platform based its findings on three key metrics: GDP (Gross Domestic Product) from the International Monetary Fund, GNI per capita from the World Bank, and median wealth per adult from the UBS Global Wealth Report.
GDP per capita reflects a country's economic output per person, GNI per capita captures the average income earned by residents (including overseas income), and median wealth per adult shows overall personal net worth, highlighting longer-term prosperity.
Using a wide range of statistics reveals how different measures of economic wealth can produce different rankings, which should be kept in mind when considering moving overseas. Relying solely on GDP can tip results towards smaller countries without reflecting the broader distribution or economic worth among residents.
![]()
Cost of living in Luxembourg*
The cost of living in Luxembourg continues to be high in 2026. However, while expensive, this tiny European country does benefit from ultra-efficient public services and provides an excellent quality of life.
Rental prices remain the most significant portion of most household budgets. For a one-bedroom flat in the capital, Luxembourg City, you're looking at roughly €1,718 ($2,057/£1,493) per month, while outside the centre it drops slightly to €1,458 ($1,746/£1,267). Utilities and internet add, on average, another €256 ($307/£223) and €50 ($60/£43), respectively, every month.
Daily life and groceries prove more manageable with 12 large eggs selling for around €4.27 ($5.11/£3.71), a litre of milk at €1.54 ($1.84/£1.34), and a loaf of bread at €2.77 ($3.32/£2.41). Dining out comes with a higher price tag, with a mid-range restaurant meal for two costing about €90 ($108/£78).
The pie chart below breaks down the average distribution of monthly expenses for living in Luxembourg.
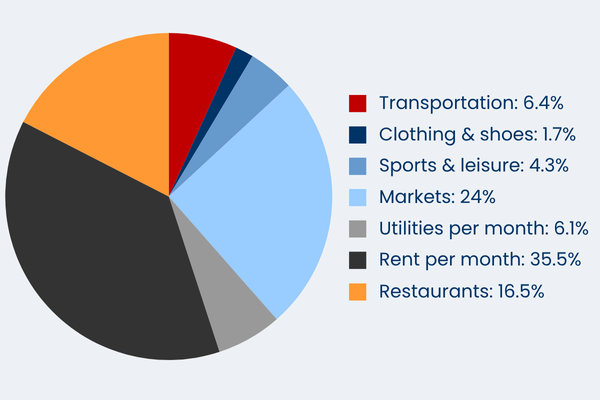
Source: www.numbeo.com
*figures accurate as of 2026
GDP vs GNP
GDP vs GNP compares two ways to measure a country's economic performance. GDP (Gross Domestic Product) measures all goods and services produced within a country's borders, including foreign companies. On the other hand, GNP (Gross National Product) includes all income earned by a country's residents and businesses, no matter where they are in the world, and then subtracts income earned by expats.
Most global wealth rankings use GDP (per capita) to compare wealth between countries as it better reflects the local economy and residents' living standards. For instance, countries such as Singapore, Ireland, and Hong Kong have high GDPs due to the activities of large multinational foreign companies. GNP provides a more accurate picture of a country's economic growth and income if those foreign companies were no longer operating there.

Top 10 richest countries in the world*
The top 10 richest countries in the world are Luxembourg, Switzerland, Norway, Denmark, Australia, the US, Ireland, Singapore, the Netherlands, and Belgium, as of 2026 according to Visual Capitalist's latest Richest Countries in the World report.
Here's some more information about the finances of these wealthy nations:

1. Luxembourg
Luxembourg's strong banking sector and favourable tax environment attract multinational corporations. Despite its small size, there is a high concentration of investment funds and strong financial regulation.
The nation's GDP per capita is among the highest globally, supported by political stability, a skilled workforce, and cross-border employment. While salaries are high, the gap between GDP and GNI per capita suggests that much of Luxembourg's wealth goes to foreign firms.
GDP per capita: $103,909 (£75,418/€86,755)
GNI per capita: $91,470 (£66,390/€76,370)
Median wealth per adult: $395,340 (£297,795/€342,681)
Avg. annual salary (gross): $94,447 (£68,550/€78,856)
Inflation: 3.1%
Public debt as a % of GDP: 26.3%

2. Switzerland
Switzerland's finances reflect a highly developed, stable economy with reliable institutions and low unemployment. High GDP and GNI per capita indicate strong productivity, while the average salary is among the highest globally.
Inflation is at its lowest in almost four years, and public debt is relatively low. However, median wealth is comparatively modest. Finance, pharmaceuticals, and high-value exports bolster the economy, supported by political neutrality and a strong currency.
GDP per capita: $89,783 (£65,123/€74,962)
GNI per capita: $95,220 (£69,067/€79,501)
Median wealth per adult: $182,248 (£137,280/€157,973)
Avg. annual salary: $87,468 (£63,444/€73,029)
Inflation: 0.1%
Public debt as a % of GDP: 15.7%
3. Norway
A strong welfare system and abundant oil and gas reserves support Norway's economy. The country's high GNI per capita reflects significant overseas investments, primarily driven by its sovereign wealth fund.
Public debt exceeds half of GDP. However, vast state-held assets offset this, including complete control of critical infrastructure and energy producers. Inflation is moderate, and substantial salaries reflect a robust labour market and a high cost of living.
GDP per capita: $79,670 (£57,788/€66,518)
GNI per capita: $98,170 (£71,207€81,964)
Median wealth per adult: $142,501 (£107,340/€123,520)
Avg. annual salary: $74,864 (£54,302/€62,505)
Inflation: 3.2%
Public debt as a % of GDP: 55.1%
4. Denmark
Denmark combines high personal wealth with strong public finances. Its GNI per capita notably exceeds GDP, indicating significant income from abroad. The country's median wealth per adult is high, pointing to a fair distribution of salaries.
Inflation remains modest, and public debt is well below the EU average of 88.8%. Denmark's economy includes strong pharmaceutical and renewable industries, supported by an efficient welfare state and high trust in public institutions.
GDP per capita: $63,230 (£45,863/€64,983)
GNI per capita: $72,540 (£52,616/€52,792)
Median wealth per adult: $216,098 (£162,778/€187,314)
Avg. annual salary: $74,022 (£53,691/€61,802)
Inflation: 1.9%
Public debt as a % of GDP: 31.1%
5. Australia
Australia's economy benefits from high personal wealth, a strong property market, and compulsory retirement savings. GDP and GNI per capita are relatively strong, inflation is moderate, and public debt remains manageable.
The economy relies heavily on services, with important roles played by mining, education, and farming sectors. Strong trade links with Asia and a history of steady government finances further boost the country's financial outlook.
GDP per capita: $61,212 (£44,399/€51,107)
GNI per capita: $62,680 (£45,465/€52,332)
Median wealth per adult: $268,424 (£202,194/€232,670)
Avg. annual salary: $70,736 (£51,308/€59,059)
Inflation: 3.8%
Public debt as a % of GDP: 43.8%

6. The United States
The US's large economy includes strong GDP and GNI per capita, though broad income inequality tempers its nationwide impact. Median wealth per adult is relatively low compared to the country's overall output, suggesting a concentration among fewer people.
Public debt is very high, driven by government overspending. The US benefits from reserve currency status, and its economy is based on global influence in tech and defence.
GDP per capita: $66,683 (£48,368/€55,675)
GNI per capita: $83,490 (£60,559/€69,707)
Median wealth per adult: $89,105 (£67,119/€77,236)
Avg. annual salary: $82,933 (£60,155/€69,242)
Inflation: 2.7%
Public debt as a % of GDP: 124%

7. Ireland
Ireland ranks among the highest globally in terms of GDP per capita. However, the presence of multinational corporations such as Apple, Alphabet (Google), Meta, and Pfizer heavily influence figures. The significantly lower GNI per capita reflects residents' wealth more accurately. Unemployment is low, inflation is stable, and public debt is modest. The economy is export-driven, with key roles for technology and pharmaceuticals.
GDP per capita: $91,514 (£66,379/€76,407)
GNI per capita: $80,650 (£58,499/€67,336)
Median wealth per adult: $108,919 (£82,044/€94,411)
Avg. annual salary: $60,431 (£43,833/€50,455)
Inflation: 2.8%
Public debt as a % of GDP: 38.8%

8. Singapore
Thanks to its booming shipping port and international business centre, Singapore is highly developed and export-oriented. However, the gap between GDP and GNI per capita reflects the influence of foreign multinationals. Unemployment is very low, and inflation is well contained. On paper, public debt is exceptionally high, but the government primarily uses it for investment, backed by substantial national assets.
GDP per capita: $67,707 (£49,111/€56,530)
GNI per capita: $74,750 (£54,220/€62,410)
Median wealth per adult: $113,976 (£85,854/€98,794)
Avg. annual salary: $61,203 (£44,393/€51,099)
Inflation: 1.2%
Public debt as a % of GDP: 173%
9. Netherlands
Thanks to its central role in global trade and strong infrastructure, the Netherlands boasts a stable, diversified economy. GDP per capita is high, though its lower GNI reflects significant profits to foreign investors. Median wealth is solid, and unemployment remains low. Inflation is slightly elevated, but manageable. The Dutch economy benefits from a highly educated workforce and strong institutions.
GDP per capita: $51,471 (£37,334/€42,974)
GNI per capita: $62,520 (£45,349/€52,199)
Median wealth per adult: $131,896 (£99,352/€114,327)
Avg. annual salary: $75,370 (£54,669/€62,928)
Inflation: 2.8%
Public debt as a % of GDP: 43.7%

10. Belgium
Belgium has a strong, services-based economy closely linked to EU trade and decision-making. GDP and GNI per capita are respectable, with a modest gap between them. Median wealth per adult is high, partly due to a home ownership rate of 70.2% and strong pension assets. However, unemployment is rising, and public debt exceeds 100% of GDP.
GDP per capita: $44,838 (£32,523/€37,436)
GNI per capita: $55,290 (£40,104/€46,163)
Median wealth per adult: $253,539 (£190,981/€219,768)
Avg. annual salary: $76,109 (£55,205/€63,545)
Inflation: 2.06%
Public debt as a % of GDP: 104%
*figures accurate as of 2026
Sources: imf.org, data.worldbank.org, ubs.com/us, ec.europa.eu, tradingeconomics.com, oecd.org
Discover more moving abroad inspiration

Best healthcare systems in the world
Discover the best healthcare systems in the world in this guide! Read now to learn about world healthcare rankings, where to get free healthcare and more.

Best countries to live and work
Discover the best countries to live and work! Covering the countries that can offer you a better career, a new adventure or a little slice of paradise.

Most expensive cities in the world
The most expensive city in the world is Singapore — find out why, plus, what the most expensive cities in the US and Europe are in this guide.

Safest countries in the world
Discover why Iceland, Denmark and Ireland are some of the safest countries in the world and where else is on the Global Peace Index.
Sign up to find outmore about our MoveCube®!

Looking for safe and secure international shipping and removals?