Unfortunately, due to the ongoing conflict in the Middle East, shipping lines have temporarily suspended shipments to and from the UAE, Oman, Kuwait, Qatar, Bahrain, and Saudi Arabia until further notice.


Global migration insights
Most moved to countries: Seven Seas Worldwide's Movers Report 2025
Key takeaways
- People are moving to Luxembourg, Switzerland, Denmark, Australia, Spain, Norway, the Netherlands, Italy, Iceland, and Sweden, according to the Seven Seas Worldwide 2025 Movers Report.
- Net migration represents the difference between the number of people entering a country (immigration) and those leaving it (emigration) over a specified period, typically one year.
- To determine our Seven Seas Move Score, we analysed data from over 20 trusted statistical bodies covering migration patterns, economic conditions, safety, and quality of life for 173 countries.


Where are people moving to in 2025?
People are moving to Luxembourg, Switzerland, Denmark, Australia, Spain, Norway, the Netherlands, Italy, Iceland, and Sweden, according to the Seven Seas Worldwide 2025 Movers Report. Using our unique methodology, we've examined the nations with the strongest economies, safest streets, best living standards, most stable governance, and greatest travel appeal. The ten countries above have received the highest Seven Seas Move Score, making them a magnet for migrants looking to start a new life overseas.
![]()
Why is Ukraine's migration rate so high?
Ukraine's migration rate is so high (36.5 migrants per 1,000 population — the world's highest net migration score in 2024), due to the return of displaced citizens following years of conflict caused by the Russo-Ukrainian War.
An excellent example of positive net migration driven by repatriation rather than new immigration, increased stability in some of the country's key regions and international support for reconstruction have drawn huge numbers of Ukrainians back home, underscoring the population's resilience and the global interest in helping rebuild one of Europe's most dynamic nations.
A positive rate means more people are arriving in a country than departing it...
What is net migration?
Net migration represents the difference between the number of people entering a country (immigration) and those leaving it (emigration) over a specified period, typically one year. A positive rate indicates that more people are moving to a country than departing it, while a negative rate suggests that more citizens are moving away.
It's a helpful indicator of a nation's overall migration balance, reflecting economic equality, safety, political stability, and quality of life. Countries with higher net migration rates are often seen as attractive destinations for work, education, or a better standard of living.
However, net migration doesn't always tell the whole story. While it highlights the balance of people moving, it cannot explain the reasons behind these relocations or the types of migration involved — such as refugees, temporary workers, or returning citizens. A country might have a high inflow due to conflict in a neighbouring region, or a low one because of strict immigration policies rather than low desirability.
For that reason, while net migration is a valuable starting point, it's best understood alongside other factors, such as the cost of living, employment opportunities, and crime rates, to accurately assess global migration trends.


Seven Seas Worldwide's Movers Report 2025: the complete list
Explore the world's most sought-after destinations for relocation, based on migration trends, affordability, safety, and quality of life.
| Rank | Country | Migration Flow | Cost Efficiency | Innovation Hub | Security Score | Living Standard | Travel Appeal | Seven Seas Move Score |
|---|---|---|---|---|---|---|---|---|
| 1 | Ukraine | 0.30 | 0.11 | 0.03 | 0.09 | 0.06 | 0.01 | 0.60 |
| 2 | Luxembourg | 0.14 | 0.16 | 0.05 | 0.13 | 0.08 | 0 | 0.56 |
| 3 | Switzerland | 0.11 | 0.13 | 0.07 | 0.14 | 0.08 | 0.02 | 0.55 |
| 4 | Denmark | 0.09 | 0.14 | 0.07 | 0.13 | 0.09 | 0.02 | 0.54 |
| 5 | Australia | 0.11 | 0.13 | 0.05 | 0.10 | 0.08 | 0.05 | 0.53 |
| 6 | Spain | 0.10 | 0.12 | 0.04 | 0.11 | 0.09 | 0.06 | 0.52 |
| 7 | Norway | 0.10 | 0.14 | 0.06 | 0.13 | 0.09 | 0.01 | 0.52 |
| 8 | Netherlands | 0.10 | 0.14 | 0.05 | 0.13 | 0.08 | 0.01 | 0.52 |
| 9 | Italy | 0.10 | 0.12 | 0.04 | 0.11 | 0.08 | 0.08 | 0.51 |
| 10 | Iceland | 0.09 | 0.13 | 0.06 | 0.14 | 0.08 | 0 | 0.51 |
| 11 | Sweden | 0.10 | 0.13 | 0.06 | 0.12 | 0.09 | 0.01 | 0.51 |
| 12 | Germany | 0.09 | 0.13 | 0.04 | 0.12 | 0.08 | 0.05 | 0.51 |
| 13 | France | 0.08 | 0.12 | 0.05 | 0.10 | 0.08 | 0.06 | 0.51 |
| 14 | Austria | 0.10 | 0.12 | 0.04 | 0.13 | 0.09 | 0.02 | 0.51 |
| 15 | Ireland | 0.11 | 0.14 | 0.05 | 0.12 | 0.08 | 0 | 0.50 |
| 16 | Finland | 0.09 | 0.13 | 0.05 | 0.13 | 0.09 | 0.01 | 0.50 |
| 17 | United Kingdom | 0.10 | 0.13 | 0.05 | 0.11 | 0.08 | 0.04 | 0.50 |
| 18 | Singapore | 0.10 | 0.12 | 0.06 | 0.14 | 0.07 | 0.01 | 0.50 |
| 19 | United States | 0.10 | 0.13 | 0.07 | 0.08 | 0.08 | 0.04 | 0.50 |
| 20 | Czech Republic | 0.09 | 0.13 | 0.04 | 0.14 | 0.08 | 0.02 | 0.49 |
| 21 | Belgium | 0.10 | 0.13 | 0.04 | 0.11 | 0.09 | 0.02 | 0.49 |
| 22 | South Korea | 0.09 | 0.12 | 0.06 | 0.12 | 0.08 | 0.02 | 0.49 |
| 23 | Japan | 0.08 | 0.13 | 0.06 | 0.12 | 0.07 | 0.03 | 0.49 |
| 24 | Hong Kong | 0.09 | 0.11 | 0.07 | 0.13 | 0.08 | 0.01 | 0.49 |
| 25 | Canada | 0.11 | 0.12 | 0.05 | 0.10 | 0.07 | 0.02 | 0.48 |
| 26 | Cyprus | 0.12 | 0.12 | 0.04 | 0.12 | 0.08 | 0 | 0.48 |
| 27 | Qatar | 0.07 | 0.15 | 0.05 | 0.14 | 0.05 | 0 | 0.48 |
| 28 | China | 0.08 | 0.12 | 0.07 | 0.10 | 0.04 | 0.08 | 0.48 |
| 29 | Malta | 0.10 | 0.12 | 0.03 | 0.12 | 0.09 | 0 | 0.47 |
| 30 | Taiwan | 0.08 | 0.12 | 0.06 | 0.14 | 0.07 | 0 | 0.47 |
| 31 | Slovenia | 0.09 | 0.13 | 0.04 | 0.13 | 0.08 | 0.01 | 0.47 |
| 32 | Portugal | 0.09 | 0.11 | 0.04 | 0.13 | 0.08 | 0.02 | 0.47 |
| 33 | New Zealand | 0.10 | 0.12 | 0.05 | 0.11 | 0.08 | 0 | 0.47 |
| 34 | Hungary | 0.09 | 0.12 | 0.04 | 0.13 | 0.07 | 0.01 | 0.47 |
| 35 | Saudi Arabia | 0.12 | 0.13 | 0.04 | 0.11 | 0.05 | 0.01 | 0.46 |
| 36 | Slovakia | 0.08 | 0.13 | 0.04 | 0.13 | 0.07 | 0.01 | 0.46 |
| 37 | Croatia | 0.08 | 0.12 | 0.04 | 0.13 | 0.08 | 0.01 | 0.45 |
| 38 | United Arab Emirates | 0.06 | 0.14 | 0.05 | 0.14 | 0.06 | 0.01 | 0.45 |
| 39 | Greece | 0.08 | 0.11 | 0.03 | 0.10 | 0.09 | 0.02 | 0.45 |
| 40 | Oman | 0.07 | 0.13 | 0.04 | 0.13 | 0.06 | 0.02 | 0.43 |
| 41 | Estonia | 0.06 | 0.11 | 0.05 | 0.13 | 0.08 | 0 | 0.43 |
| 42 | Bulgaria | 0.08 | 0.11 | 0.04 | 0.12 | 0.07 | 0.01 | 0.43 |
| 43 | Israel | 0.09 | 0.12 | 0.05 | 0.10 | 0.06 | 0.01 | 0.43 |
| 44 | Poland | 0.04 | 0.13 | 0.04 | 0.12 | 0.08 | 0.02 | 0.42 |
| 45 | Brunei | 0.09 | 0.12 | 0.03 | 0.14 | 0.04 | 0 | 0.42 |
| 46 | Kuwait | 0.05 | 0.14 | 0.04 | 0.12 | 0.06 | 0 | 0.42 |
| 47 | Lithuania | 0.05 | 0.11 | 0.04 | 0.13 | 0.08 | 0 | 0.42 |
| 48 | Romania | 0.06 | 0.12 | 0.04 | 0.12 | 0.07 | 0.01 | 0.42 |
| 49 | Bahrain | 0.07 | 0.12 | 0.05 | 0.12 | 0.05 | 0.01 | 0.41 |
| 50 | Bhutan | 0.08 | 0.12 | 0.03 | 0.13 | 0.04 | 0 | 0.40 |
| 51 | Uruguay | 0.07 | 0.10 | 0.04 | 0.11 | 0.07 | 0 | 0.40 |
| 52 | Serbia | 0.08 | 0.11 | 0.03 | 0.11 | 0.06 | 0 | 0.40 |
| 53 | Malaysia | 0.09 | 0.12 | 0.04 | 0.09 | 0.05 | 0.01 | 0.40 |
| 54 | North Macedonia | 0.08 | 0.10 | 0.04 | 0.12 | 0.06 | 0 | 0.40 |
| 55 | Latvia | 0.05 | 0.11 | 0.04 | 0.12 | 0.08 | 0 | 0.40 |
| 56 | Kazakhstan | 0.08 | 0.12 | 0.03 | 0.11 | 0.06 | 0.01 | 0.40 |
| 57 | Mauritius | 0.08 | 0.11 | 0.04 | 0.12 | 0.06 | 0 | 0.39 |
| 58 | Belarus | 0.08 | 0.13 | 0.02 | 0.10 | 0.06 | 0 | 0.39 |
| 59 | Moldova | 0.08 | 0.12 | 0.04 | 0.10 | 0.06 | 0 | 0.39 |
| 60 | Chile | 0.08 | 0.10 | 0.04 | 0.09 | 0.07 | 0.01 | 0.39 |
| 61 | Bosnia and Herzegovina | 0.08 | 0.10 | 0.03 | 0.11 | 0.06 | 0 | 0.39 |
| 62 | Costa Rica | 0.09 | 0.09 | 0.03 | 0.11 | 0.07 | 0 | 0.38 |
| 63 | Bahamas | 0.10 | 0.08 | 0.05 | 0.11 | 0.04 | 0.01 | 0.38 |
| 64 | Russia | 0.08 | 0.12 | 0.03 | 0.07 | 0.05 | 0.03 | 0.38 |
| 65 | Georgia | 0.05 | 0.10 | 0.04 | 0.12 | 0.07 | 0 | 0.38 |
| 66 | India | 0.08 | 0.12 | 0.04 | 0.06 | 0.04 | 0.04 | 0.38 |
| 67 | Uzbekistan | 0.07 | 0.11 | 0.03 | 0.12 | 0.04 | 0.01 | 0.38 |
| 68 | Thailand | 0.08 | 0.11 | 0.03 | 0.09 | 0.05 | 0.02 | 0.38 |
| 69 | Panama | 0.10 | 0.09 | 0.03 | 0.10 | 0.07 | 0 | 0.38 |
| 70 | Albania | 0.06 | 0.11 | 0.03 | 0.11 | 0.07 | 0.01 | 0.38 |
| 71 | Equatorial Guinea | 0.15 | 0.08 | 0.01 | 0.11 | 0.03 | 0 | 0.38 |
| 72 | Mongolia | 0.07 | 0.11 | 0.02 | 0.11 | 0.05 | 0.01 | 0.37 |
| 73 | Paraguay | 0.08 | 0.10 | 0.03 | 0.11 | 0.05 | 0 | 0.37 |
| 74 | Timor-Leste | 0.05 | 0.12 | 0.04 | 0.11 | 0.05 | 0 | 0.37 |
| 75 | Montenegro | 0.05 | 0.11 | 0.04 | 0.11 | 0.06 | 0 | 0.37 |
| 76 | Suriname | 0.09 | 0.10 | 0.02 | 0.10 | 0.06 | 0 | 0.37 |
| 77 | Turkey | 0.07 | 0.10 | 0.02 | 0.09 | 0.06 | 0.03 | 0.37 |
| 78 | Cuba | 0.07 | 0.09 | 0.02 | 0.12 | 0.07 | 0.01 | 0.36 |
| 79 | Belize | 0.09 | 0.10 | 0.02 | 0.10 | 0.04 | 0 | 0.36 |
| 80 | Brazil | 0.08 | 0.09 | 0.03 | 0.08 | 0.06 | 0.02 | 0.36 |
| 81 | Botswana | 0.09 | 0.07 | 0.03 | 0.12 | 0.05 | 0 | 0.36 |
| 82 | Armenia | 0.05 | 0.10 | 0.03 | 0.12 | 0.06 | 0 | 0.36 |
| 83 | Mexico | 0.07 | 0.10 | 0.02 | 0.06 | 0.05 | 0.05 | 0.36 |
| 84 | Vietnam | 0.08 | 0.11 | 0.04 | 0.09 | 0.03 | 0.01 | 0.36 |
| 85 | Argentina | 0.08 | 0.10 | 0.02 | 0.08 | 0.07 | 0.01 | 0.36 |
| 86 | Azerbaijan | 0.07 | 0.10 | 0.02 | 0.11 | 0.05 | 0 | 0.36 |
| 87 | Venezuela | 0.16 | 0.09 | 0.01 | 0.05 | 0.05 | 0.01 | 0.36 |
| 88 | Bolivia | 0.07 | 0.11 | 0.02 | 0.09 | 0.06 | 0.01 | 0.36 |
| 89 | Benin | 0.08 | 0.10 | 0.02 | 0.11 | 0.04 | 0 | 0.35 |
| 90 | South Sudan | 0.19 | 0.07 | 0.01 | 0.06 | 0.02 | 0 | 0.35 |
| 91 | Cape Verde | 0.07 | 0.07 | 0.03 | 0.12 | 0.06 | 0 | 0.35 |
| 92 | Trinidad and Tobago | 0.07 | 0.10 | 0.03 | 0.09 | 0.06 | 0 | 0.35 |
| 93 | Laos | 0.07 | 0.11 | 0.02 | 0.12 | 0.02 | 0 | 0.35 |
| 94 | Tunisia | 0.07 | 0.10 | 0.03 | 0.09 | 0.05 | 0.01 | 0.35 |
| 95 | Fiji | 0.04 | 0.12 | 0.04 | 0.10 | 0.05 | 0 | 0.35 |
| 96 | Algeria | 0.07 | 0.11 | 0.02 | 0.09 | 0.05 | 0.01 | 0.35 |
| 97 | Kyrgyzstan | 0.05 | 0.12 | 0.03 | 0.10 | 0.05 | 0.01 | 0.35 |
| 98 | Iran | 0.08 | 0.10 | 0.02 | 0.07 | 0.06 | 0.02 | 0.35 |
| 99 | Ghana | 0.08 | 0.09 | 0.02 | 0.11 | 0.04 | 0 | 0.35 |
| 100 | Sri Lanka | 0.06 | 0.10 | 0.02 | 0.10 | 0.06 | 0.01 | 0.34 |
| 101 | Dominican Republic | 0.06 | 0.10 | 0.02 | 0.09 | 0.06 | 0.01 | 0.34 |
| 102 | Sierra Leone | 0.09 | 0.11 | 0.02 | 0.09 | 0.03 | 0 | 0.34 |
| 103 | Egypt | 0.08 | 0.11 | 0.02 | 0.08 | 0.04 | 0.01 | 0.34 |
| 104 | Lebanon | 0.07 | 0.08 | 0.03 | 0.09 | 0.06 | 0 | 0.34 |
| 105 | Côte d’Ivoire | 0.08 | 0.09 | 0.02 | 0.09 | 0.04 | 0.01 | 0.33 |
| 106 | Morocco | 0.07 | 0.09 | 0.02 | 0.10 | 0.05 | 0.01 | 0.33 |
| 107 | Indonesia | 0.07 | 0.11 | 0.03 | 0.06 | 0.05 | 0.01 | 0.33 |
| 108 | Ecuador | 0.07 | 0.10 | 0.03 | 0.07 | 0.06 | 0 | 0.33 |
| 109 | Cambodia | 0.06 | 0.10 | 0.03 | 0.10 | 0.04 | 0.01 | 0.33 |
| 110 | Gabon | 0.10 | 0.07 | 0.01 | 0.09 | 0.05 | 0 | 0.33 |
| 111 | Turkmenistan | 0.07 | 0.10 | 0.02 | 0.11 | 0.03 | 0 | 0.33 |
| 112 | Peru | 0.07 | 0.10 | 0.02 | 0.06 | 0.06 | 0.01 | 0.33 |
| 113 | Mauritania | 0.07 | 0.10 | 0.02 | 0.10 | 0.03 | 0 | 0.33 |
| 114 | Malawi | 0.08 | 0.10 | 0.02 | 0.10 | 0.03 | 0 | 0.33 |
| 115 | The Gambia | 0.08 | 0.10 | 0.02 | 0.10 | 0.04 | 0 | 0.33 |
| 116 | Nepal | 0.05 | 0.09 | 0.03 | 0.11 | 0.04 | 0 | 0.33 |
| 117 | Tanzania | 0.08 | 0.09 | 0.02 | 0.09 | 0.05 | 0.01 | 0.33 |
| 118 | Burkina Faso | 0.07 | 0.10 | 0.02 | 0.09 | 0.04 | 0 | 0.32 |
| 119 | Zambia | 0.08 | 0.07 | 0.02 | 0.11 | 0.04 | 0 | 0.32 |
| 120 | Niger | 0.07 | 0.12 | 0.02 | 0.07 | 0.04 | 0 | 0.32 |
| 121 | Togo | 0.07 | 0.10 | 0.02 | 0.10 | 0.03 | 0 | 0.32 |
| 122 | Guinea-Bissau | 0.06 | 0.11 | 0.01 | 0.10 | 0.04 | 0 | 0.32 |
| 123 | Namibia | 0.08 | 0.07 | 0.02 | 0.10 | 0.04 | 0 | 0.32 |
| 124 | Kenya | 0.08 | 0.10 | 0.02 | 0.08 | 0.04 | 0.01 | 0.32 |
| 125 | Guatemala | 0.07 | 0.09 | 0.02 | 0.09 | 0.04 | 0 | 0.32 |
| 126 | Guinea | 0.08 | 0.11 | 0.01 | 0.08 | 0.03 | 0 | 0.32 |
| 127 | Rwanda | 0.06 | 0.08 | 0.03 | 0.12 | 0.03 | 0 | 0.32 |
| 128 | Senegal | 0.07 | 0.07 | 0.02 | 0.10 | 0.05 | 0.01 | 0.32 |
| 129 | Iraq | 0.08 | 0.10 | 0.02 | 0.07 | 0.03 | 0 | 0.32 |
| 130 | Liberia | 0.07 | 0.10 | 0.02 | 0.08 | 0.03 | 0 | 0.31 |
| 131 | Tajikistan | 0.07 | 0.09 | 0.02 | 0.10 | 0.03 | 0 | 0.31 |
| 132 | Burundi | 0.07 | 0.11 | 0.01 | 0.09 | 0.03 | 0 | 0.31 |
| 133 | Philippines | 0.08 | 0.10 | 0.03 | 0.06 | 0.04 | 0.01 | 0.31 |
| 134 | Maldives | 0 | 0.11 | 0.03 | 0.11 | 0.05 | 0 | 0.31 |
| 135 | Jordan | 0.01 | 0.09 | 0.04 | 0.11 | 0.06 | 0.01 | 0.31 |
| 136 | Comoros | 0.06 | 0.09 | 0.01 | 0.11 | 0.03 | 0 | 0.30 |
| 137 | Madagascar | 0.08 | 0.10 | 0.02 | 0.06 | 0.04 | 0 | 0.30 |
| 138 | Jamaica | 0.03 | 0.09 | 0.03 | 0.10 | 0.05 | 0 | 0.30 |
| 139 | Pakistan | 0.07 | 0.11 | 0.02 | 0.06 | 0.03 | 0.01 | 0.30 |
| 140 | South Africa | 0.08 | 0.06 | 0.03 | 0.07 | 0.05 | 0.01 | 0.30 |
| 141 | Honduras | 0.07 | 0.09 | 0.02 | 0.07 | 0.04 | 0 | 0.30 |
| 142 | Colombia | 0.07 | 0.08 | 0.02 | 0.05 | 0.06 | 0.01 | 0.30 |
| 143 | Djibouti | 0.10 | 0.05 | 0.02 | 0.09 | 0.03 | 0 | 0.30 |
| 144 | Solomon Islands | 0.07 | 0.07 | 0.02 | 0.09 | 0.05 | 0 | 0.29 |
| 145 | Mali | 0.06 | 0.11 | 0.02 | 0.08 | 0.03 | 0 | 0.29 |
| 146 | Uganda | 0.06 | 0.10 | 0.01 | 0.09 | 0.03 | 0 | 0.29 |
| 147 | Nicaragua | 0.07 | 0.09 | 0.01 | 0.08 | 0.03 | 0 | 0.29 |
| 148 | Chad | 0.08 | 0.11 | 0.01 | 0.07 | 0.02 | 0 | 0.29 |
| 149 | Ethiopia | 0.08 | 0.08 | 0.02 | 0.08 | 0.03 | 0.01 | 0.29 |
| 150 | Bangladesh | 0.06 | 0.11 | 0.02 | 0.06 | 0.04 | 0 | 0.29 |
| 151 | Nigeria | 0.08 | 0.10 | 0.02 | 0.07 | 0.02 | 0 | 0.29 |
| 152 | Cameroon | 0.08 | 0.09 | 0.01 | 0.07 | 0.03 | 0 | 0.28 |
| 153 | Guyana | 0.04 | 0.09 | 0.01 | 0.09 | 0.04 | 0 | 0.28 |
| 154 | Syria | 0.07 | 0.10 | 0.01 | 0.05 | 0.04 | 0.01 | 0.28 |
| 155 | El Salvador | 0.03 | 0.10 | 0.02 | 0.08 | 0.04 | 0 | 0.28 |
| 156 | Zimbabwe | 0.06 | 0.08 | 0.02 | 0.09 | 0.03 | 0 | 0.28 |
| 157 | Lesotho | 0.05 | 0.07 | 0.02 | 0.09 | 0.03 | 0 | 0.27 |
| 158 | Libya | 0.06 | 0.09 | 0.01 | 0.06 | 0.04 | 0 | 0.27 |
| 159 | Congo | 0.08 | 0.04 | 0.01 | 0.10 | 0.03 | 0 | 0.27 |
| 160 | Myanmar | 0.07 | 0.12 | 0.02 | 0.04 | 0.02 | 0 | 0.27 |
| 161 | Papua New Guinea | 0.08 | 0.08 | 0.02 | 0.05 | 0.04 | 0 | 0.26 |
| 162 | Afghanistan | 0.08 | 0.09 | 0.02 | 0.05 | 0.02 | 0 | 0.26 |
| 163 | Sudan | 0.07 | 0.07 | 0.01 | 0.07 | 0.03 | 0 | 0.25 |
| 164 | State of Palestine | 0.05 | 0.08 | 0.03 | 0.06 | 0.03 | 0 | 0.25 |
| 165 | Angola | 0.08 | 0.03 | 0.02 | 0.08 | 0.04 | 0 | 0.24 |
| 166 | Eritrea | 0.02 | 0.08 | 0.01 | 0.11 | 0.02 | 0 | 0.24 |
| 167 | Haiti | 0.07 | 0.07 | 0 | 0.06 | 0.03 | 0 | 0.24 |
| 168 | Central African Republic | 0.06 | 0.09 | 0.01 | 0.05 | 0.02 | 0 | 0.24 |
| 169 | Yemen | 0.08 | 0.08 | 0.01 | 0.04 | 0.02 | 0 | 0.23 |
| 170 | DR Congo | 0.07 | 0.05 | 0.01 | 0.06 | 0.03 | 0 | 0.23 |
| 171 | Mozambique | 0.07 | 0.06 | 0.01 | 0.05 | 0.03 | 0 | 0.22 |
| 172 | Eswatini | 0.04 | 0.02 | 0.02 | 0.11 | 0.02 | 0 | 0.21 |
| 173 | Somalia | 0.07 | 0.06 | 0.01 | 0.04 | 0.02 | 0 | 0.21 |

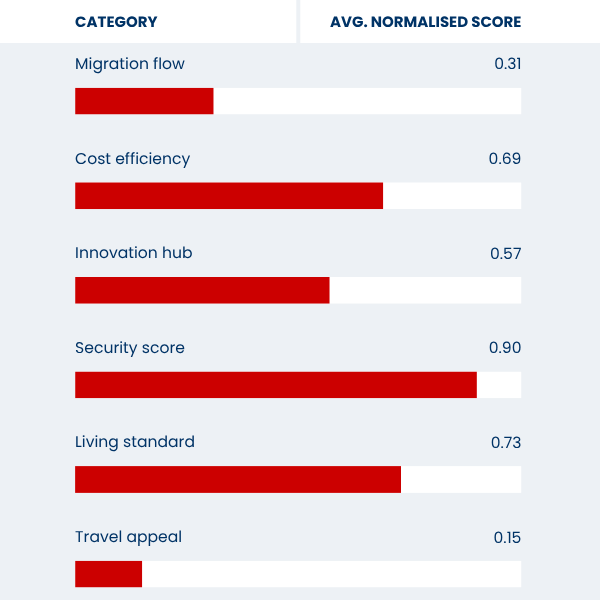
Luxembourg: most moved-to country 2025
Capital: Luxembourg City | Region: Europe | Population: 677,717
Luxembourg takes the crown as the world's most moved-to country in 2025 — and it's not hard to see why! This small but mighty European nation offers an exceptional blend of economic strength, safety, and living standards that attract people from all corners of the globe.
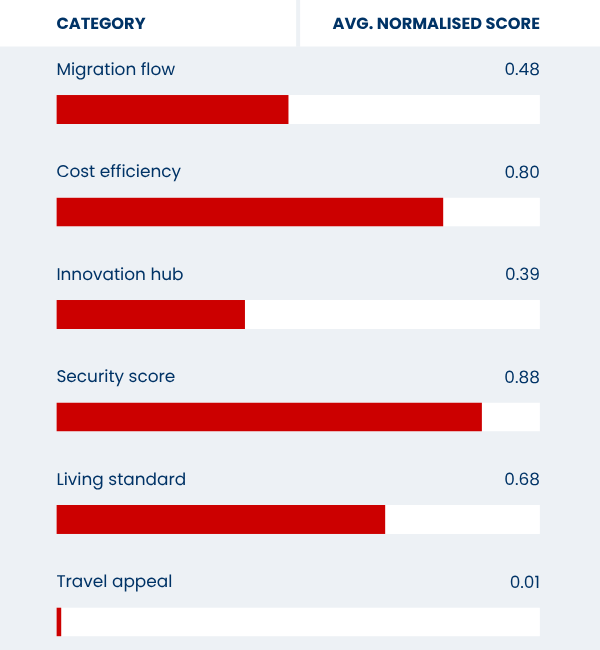
Scoring first overall for cost efficiency, Luxembourg proves that high living costs don't necessarily mean poor value. Its residents enjoy some of the world's highest GDP per capita and local purchasing power, meaning money goes further despite premium prices.
Add to that the country's low vulnerability to natural disasters and strong political stability, and it becomes clear why many view Luxembourg as a haven of security and prosperity.
But Luxembourg's appeal extends beyond finances. The country also ranks second globally for environmental performance and human rights, highlighting its commitment to sustainable living and social equality — key ingredients for a high quality of life.
However, life in Luxembourg isn't without its trade-offs. It ranks relatively low in terms of travel appeal, with no national parks, just one UNESCO site, and limited tourism activity compared to its larger European neighbours. Its small labour force may also pose challenges for those seeking a more dynamic or expansive job market.
Luxembourg rankings

Switzerland: best country for entrepreneurs
Capital: Bern | Region: Europe | Population: 9,340,000
Standing out as an innovation powerhouse, Switzerland's thriving start-up ecosystem and reputation for clockwork efficiency make it a magnet for ambitious professionals and investors.
The Land of Cheese and Chocolate also has the lowest corporate tax rate amongst the top ten countries in our Movers Report and one of the highest GDPs per capita anywhere in the world, further strengthening its appeal as a destination for global enterprise. Backed by strong access to credit, high local purchasing power, and a culture that rewards innovation, the country continues to attract businesses seeking both opportunity and security.
Switzerland also ranks among the safest countries globally, offering residents peace of mind alongside professional prospects and boasts natural beauty that few nations can rival.
Yet, as with all great opportunities, there's a cost to such a high quality of life. Switzerland is officially the most expensive country in the ranking, with a score of zero for affordability in the cost-of-living index. However, many see this not as a drawback but as a reflection of quality — a country where infrastructure, healthcare, education, and stunning scenery all come at a premium.

Switzerland rankings

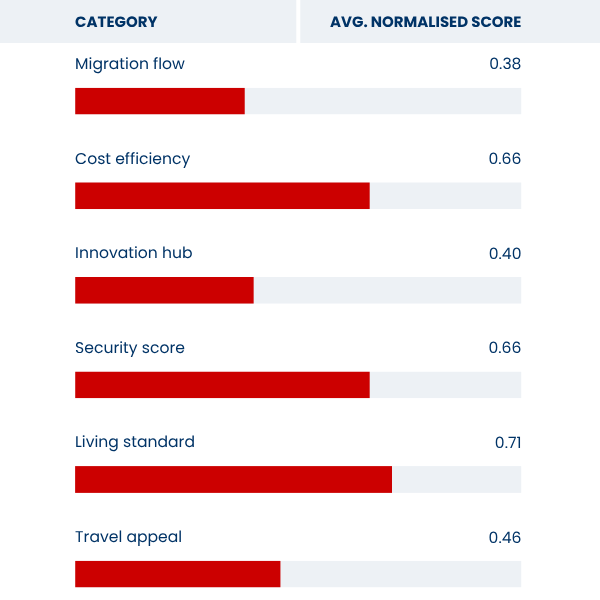
Denmark: best country for equality
Capital: Copenhagen | Region: Europe | Population: 5,977,000
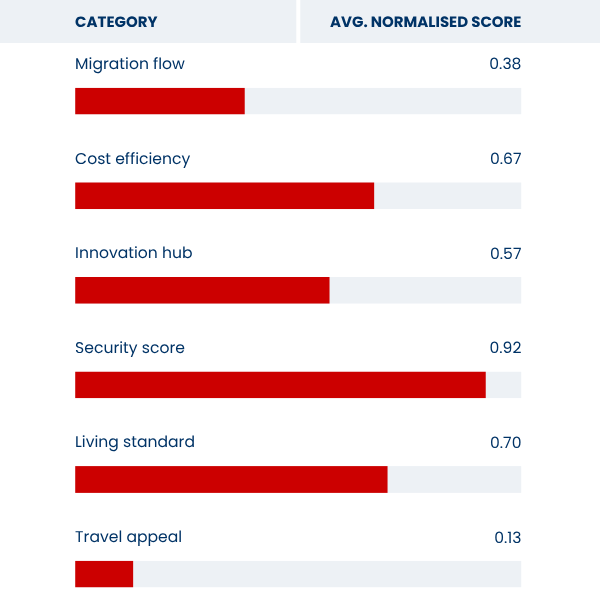
Long admired for its fairness, progressiveness, and social cohesion, Denmark is one of the world's least corrupt nations, reflecting a deep-rooted culture of trust in and transparency from the government. This commitment to integrity has fostered an environment where creativity thrives — so much so that Denmark shares the top spot with Switzerland as a global innovation hub.
Economically, Denmark performs strongly across key indicators of stability and prosperity, ranking second in our report for its low unemployment rate, a testament to its robust labour market and well-balanced economy.
Denmark's model (often referred to as "flexicurity") combines flexible hiring and firing rules with generous social safety nets, enabling both workers and employers to adapt quickly in a changing economy.
Yet, even in such a well-rounded society, challenges remain. Denmark records one of the lowest numbers of medical doctors per 10,000 people among the top ten countries, occasionally stretching its otherwise strong healthcare system.
Its high cost of living may also deter some newcomers, although many view it as the natural consequence of a well-managed and high-performing society.
Denmark rankings
![]()
What country has the highest standard of living?
The country with the highest living standard is Greece, according to this year's Movers Report — a reflection of its rich culture, enviable climate, and strong sense of community. Despite economic challenges, Greece has steadily rebuilt its social infrastructure, enhancing public services and healthcare to provide residents with a balanced lifestyle that blends modern comforts with Mediterranean charm.
At the opposite end of the scale, Eritrea ranks lowest in terms of living standards, highlighting the stark global inequalities that still exist. The country faces ongoing struggles with limited economic opportunities, restricted freedoms, and inadequate access to education and medical services. While Eritrea's natural beauty and rich cultural heritage offer glimmers of potential, systemic barriers continue to hold it back.

Australia: best country for adventure
Capital: Canberra | Region: Oceania | Population: 27,200,000
From its golden beaches to its rugged Outback, a move to Australia offers endless opportunities for exploration — and it's clear that the appeal extends well beyond tourism. With 5.9 migrants per 1,000 people, Australia ranks among the most moved-to nations in 2025, tied with Switzerland and second only to Luxembourg. This strong migration figure highlights the country's enduring reputation as a land of adventure and friendly locals.
Australia's high standard of living is matched by some impressive achievements. The country ranks joint first with Switzerland for the highest life expectancy, demonstrating that proximity to nature and an advanced healthcare system have tangible benefits for longevity.
It also ranks first in our Movers Report for tertiary school enrolment, underlining the strength of its education system and its ability to attract and nurture talent. Additionally, Australia is home to the largest number of national parks in the world, showcasing its extraordinary biodiversity and commitment to environmental stewardship.
The biggest drawback to moving Down Under is exposure to natural hazards such as bushfires, floods, and extreme weather — the price of living in such a vast and varied landscape. Plus, the country's corporate tax rate remains relatively high, which may add pressure on new businesses or international investors.

Australia rankings

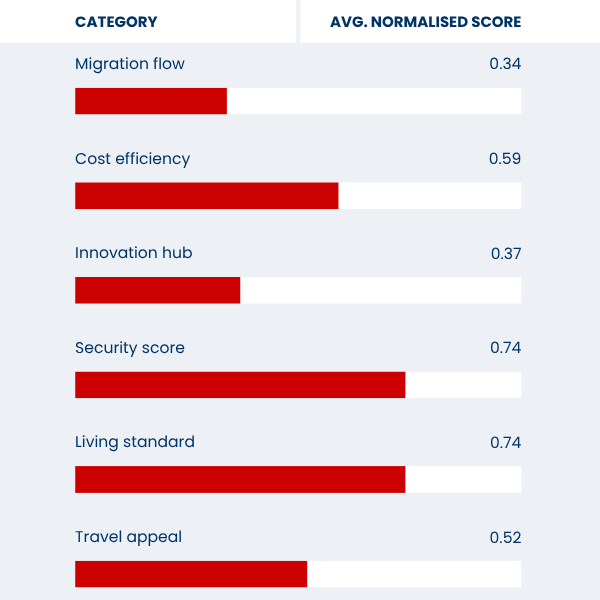
Spain: best country for quality of life
Capital: Madrid | Region: Europe | Population: 48,810,000
In our Movers Report for 2025, Spain stands out as the most affordable destination, offering an enviable mix of sunshine, culture, and value for money.
Among the top ten nations, Spain ranks number one in terms of cost of living, making it an ideal choice for those seeking a laid-back pace in a desirable setting without a hefty price tag.
Spain's advantages extend beyond its low living costs. Consistently performing well in areas related to happiness and health (including having a high life expectancy and strong human rights record), the country's Mediterranean lifestyle attracts migrants from across Europe and beyond, hoping to swap rainy days and working late for strolls along the beach and a healthy work-life balance.
However, this sunny haven comes with a few economic challenges. Spain has the lowest GDP per capita among our leading countries and the highest unemployment rate, which may pose hurdles for those seeking immediate job opportunities.
It also records one of the lowest levels of domestic credit to the private sector, indicating limited access to capital for entrepreneurs or small businesses.
Spain rankings
![]()
What is the safest country?
The safest country is Singapore, a title earned through its unwavering commitment to order, stability, and trust. With exceptionally low crime rates, efficient law enforcement (including a ban on chewing gum to keep the streets sparkling!), and a culture that values respect and responsibility, Singapore has created an environment where residents and visitors feel secure day and night.
Sadly, Somalia's political instability makes it the world's most dangerous country. Decades of armed conflict have created an environment where security remains fragile, with crime, terrorism, and poverty making daily life precarious for many citizens. Yet, amidst these difficulties, there are signs of resilience as communities strive to pursue peace and progress.
Unlike some of its flashier European neighbours, this peaceful Nordic nation doesn't rely on extremes to impress...
Exploring the rest of our top ten most moved to countries
Ranking fifth on our Movers Report for 2025, Norway earns the title of the best country for stability. Unlike some of its flashier European neighbours, this peaceful Nordic nation doesn't rely on extremes to impress; instead, it quietly excels across the board. Boasting an exceptional education system and easy access to top medical care, Norway represents a haven of quality and consistency. However, its high cost of living might make it less appealing for budget-conscious movers.
The Netherlands, celebrated as the most inclusive country on our list, stands out for its progressive social values and best wealth inequality score among the top ten. While the number of medical doctors per capita is among the lowest in this group, the Netherlands compensates with its forward-thinking culture and dynamic urban life, making it a natural draw for expats seeking community and opportunity in equal measure.
...Italy is home to the most UNESCO World Heritage Sites and receives record numbers of tourists each year.
Taking the crown as the best country for culture, thanks to its rich historical legacy, Italy is home to the most UNESCO World Heritage Sites and receives record numbers of tourists each year. Its population also enjoy one of the highest life expectancies, showing that la dolce vita is more than just a saying — it's a way of life. On the flip side, Italy is environmentally vulnerable, with a world risk score second only to Australia, and experiences frequent earthquakes and significant volcanic activity.
Next on the list is Iceland, the place to move for digital nomads. Blending natural wonder with cutting-edge connectivity, the Land of Ice and Fire's lightning-fast internet, remarkable political stability, and low crime rate make it ideal for remote workers seeking serenity and productivity. Unfortunately, Iceland's appeal is tempered for some due to steep living costs, a limited labour force, and unpredictable weather.
Rounding out the top ten is Sweden, recognised as the best for healthcare. It ranks first for human rights and the number of medical doctors, alongside a strong environmental record, making it one of the healthiest and most equitable countries globally. Yet Sweden also contends with the highest crime rate and second-highest unemployment among the top ten — highlighting that even the most advanced societies face challenges.


...the final Seven Seas Move Score — a single, comparable figure that shows overall liveability and appeal for new arrivals.
Our methodology: how we calculated the Seven Seas Move Score
To determine our Seven Seas Move Score, we analysed data from over 20 trusted statistical bodies covering migration patterns, economic conditions, safety, and quality of life for 173 countries. The only nations not included in our report are those with populations less than 150,000 (such as Liechtenstein, the Seychelles and Micronesia) and North Korea, due to a lack of quality data.
We then used the following migration methodology to work out each country's final score (between 0 and 1):
1. Data collection
We began by gathering figures from reputable organisations such as the IMF, World Bank Group, Transparency International, Numbeo, and the United Nations. Each metric represented a specific factor that affects how appealing a country is to live in, work in, or relocate to — for example, net migration rates, GDP per capita, corruption levels, life expectancy, and environmental performance.
To reflect migrants' differing priorities, these statistics were then grouped into six categories: Migration Flow, Cost Efficiency, Innovation Hub, Security Score, Living Standard, and Travel Appeal.
2. Normalisation of the data
As each dataset uses different measurements, such as percentages, scores, or index values, we normalised the data to make fair comparisons between countries, converting all values to a scale between 0 (lowest performance) and 1 (highest performance).
- For metrics where higher values are better (such as GDP per capita or life expectancy), higher scores translate to higher normalised values.
- For metrics where lower values are better (such as the unemployment rate or cost of living), the scale is reversed so that lower figures produce higher scores.
3. Each category is averaged
The normalised scores for each country were then averaged within their category. For example, a country's "Cost Efficiency" would reflect the average of its normalised results for local purchasing power, cost of living, GDP per capita and wealth inequality.
4. And each category is assigned a weight
Next, we assigned each of the six categories a weight to reflect their impact on migration decisions:
- Migration Flow: 30% (most important)
- Cost Efficiency: 20%
- Innovation Hub: 15%
- Security Score: 10%
- Living Standard: 10%
- Travel Appeal: 10%
The weighted scores for each country were then calculated to create the final Seven Seas Move Score — a single, comparable figure that shows overall liveability and appeal for new arrivals.
5. Ranking the countries
Finally, we ranked all countries from highest to lowest based on their Seven Seas Move Score. A higher score indicates stronger performance across the combined economic, safety, and quality-of-life indicators — making that country one of the most moved-to destinations of 2025.
While the world's smallest nation is the Vatican City, there are
42
countries with populations under 150,000

Movers Report categories explained
To uncover the world's most moved-to countries in 2025, we analysed a range of social, economic, and environmental factors grouped into six key categories. Below, we discuss each in more detail:
Migration Flow:
This category focuses on the Net Migration Rate (migrants per 1,000 of the normal population), which is the difference between the number of people entering a country and those leaving it.
Cost Efficiency:
This category examines how far your money goes in each country.
- Local Purchasing Power: how much people can buy with their income.
- Cost of Living: measures daily expenses like groceries, rent, and transportation.
- GDP per Capita: the nation's overall wealth and prosperity.
- Unemployment Rate: indicates the availability of jobs.
- Wealth Inequality (Gini Coefficient): reflects how evenly income is distributed among citizens.
Innovation Hub:
This category explores a nation's potential for business, entrepreneurship, and technological growth.
- Corporate Tax Rate: lower rates encourage business investment.
- Corruption Perceptions Index: measures transparency and trust in a nation's governance.
- Total Labour Force: the availability of skilled workers.
- Internet Speed: essential for digital connectivity and modern business.
- Domestic Credit to Private Sector: indicates financial support for businesses.
Security Score:
This category reflects a country's safety and stability.
- Crime Rate: calculates the likelihood of crime affecting residents.
- Political Stability: assesses the risk of unrest, including protests and coups.
- The World Risk Index: considers exposure to natural disasters and vulnerability.
Living Standard:
This category assesses the overall quality of life in terms of health, education, and environmental well-being.
- Life Expectancy: represents general health and longevity.
- Tertiary School Enrollment: indicates access to higher education.
- Environmental Performance Index: measures sustainability and ecological care.
- Human Rights Index: assesses fairness, equality, and freedom.
- Number of Medical Doctors (Per 10k): reflects how easy it is to receive medical care.
- Minimum Paid Leave: supports work-life balance.
Travel Appeal:
This category measures a country's cultural and natural allure — the qualities that make it a place people want to visit and explore.
- Number of National Parks: showcases natural beauty and biodiversity.
- Number of UNESCO Sites: highlights cultural heritage and history.
- Tourist Arrivals: the number of tourists visiting a country in a year.
Discover more moving abroad inspiration

Most beautiful country in the world
The most beautiful countries in the world are Greece, New Zealand, Italy, Switzerland, Spain and Thailand. Click to discover the most beautiful cities and states.

Happiest country in the world
The happiest country in the world is Finland, followed by Denmark, Iceland, Sweden, the Netherlands, Costa Rica, Norway, Israel, Luxembourg and Mexico.

When is the best time to move?
The best time to move is in winter, as rental prices and removal costs often drop because fewer people relocate during the colder months.

Easiest countries to get citizenship
The easiest countries to get citizenship in 2025 include Italy, Portugal, Malta, Hungary, Dominica, Grenada, St Kitts and Nevis, and Antigua and Barbuda.
Sign up to find outmore about our MoveCube®!

Looking for safe and secure international shipping and removals?